

The extent of misinformation about “renewables” - the dishonesty in regard to the ability of “renewables” to replace fossil-fuelled sources of electricity is horrifying. Consider this exchange in X (formerly Twitter):

Notice that Yelland was quick to state the negative - but failed to state the positive - he failed to state what he believes South Africa’s economy should be run on. He was challenged - but he continued to avoid the central question asked.

Note that Yelland had nothing to add (as of 23h00, April 3 2024).
In my opinion Yelland is one of a clique of “true believers” who - for various reasons - will tell the gullible that South Africa’s economy can be run on “renewables” alone, with no help from fossil-fuelled generators (fuelled with the likes of coal and “natural” gas). These people exploit the fact that “renewables” is a misleading appellation applied to very different methods of electricity generation and which is usually not used alone but in the phrase “renewables and storage”. The purpose of this post is to record the performance of non-fossil-fuelled electricity generators in South Africa. I’m a data-driven kind of person. I want to know what’s in the data. I’ve little interest in a person’s personal bigotries. Let’s start by asking: Could South Africa’s economy be run on wind and solar? To answer this question, I downloaded the data Eskom, South Africa’s primary source of electricity, supplies and plotted it. The dataset supplies a value for every hour of the 24 in a day. I divided the output in an hour by the maximum potential output in that hour to get a value between 0 and 1 (0 and 100 when expressed as a percentage). My plots are for February and March of 2024.
Wind
Some say that wind is the best “renewable” of all. Let’s examine the performance of wind in South Africa.
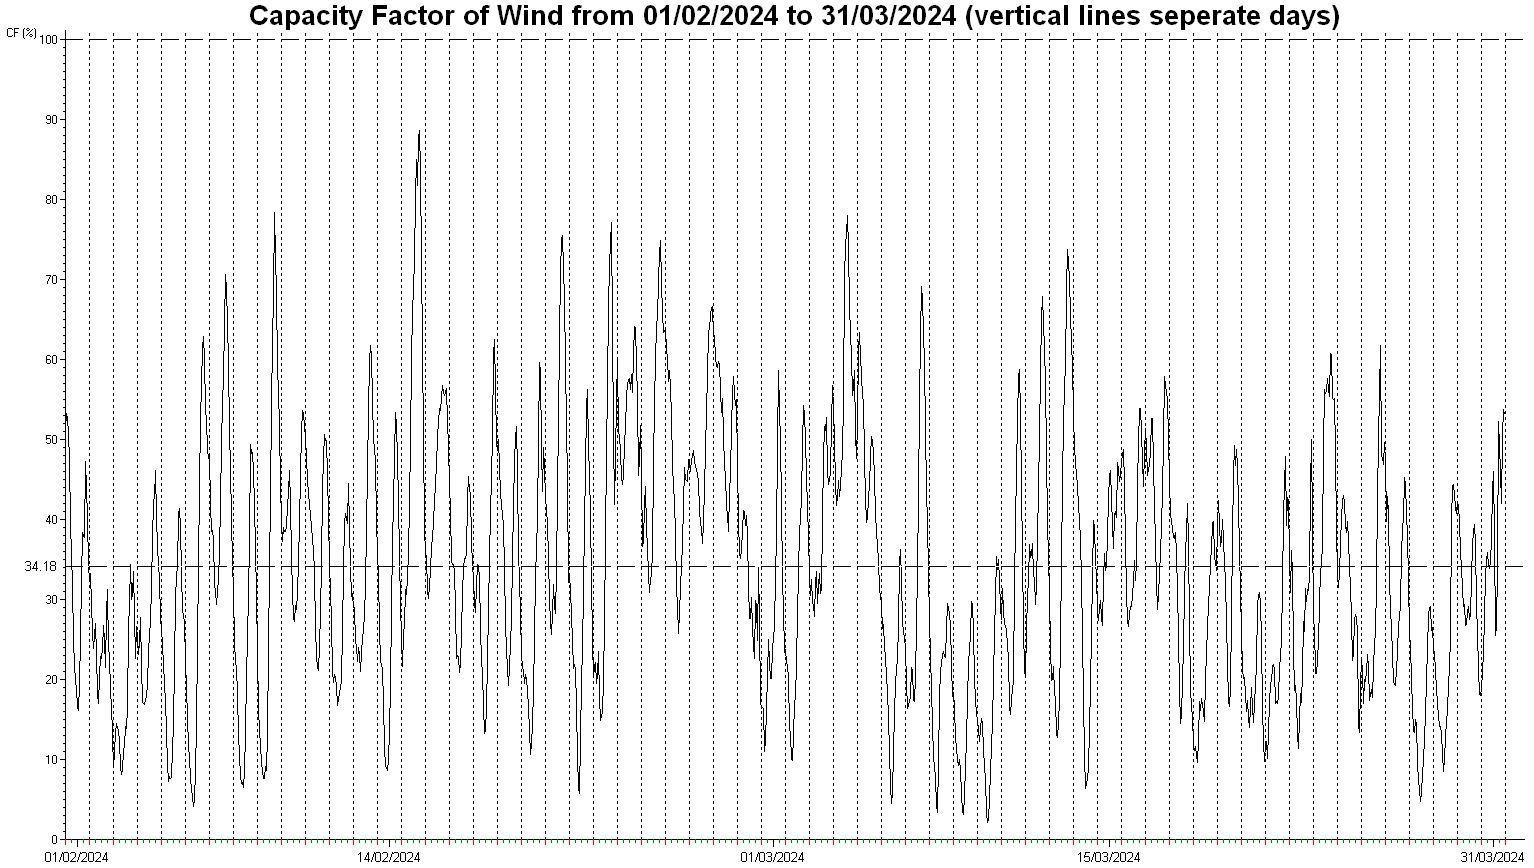
For the period plotted (the first of February to the 31st of March 2024) South Africa has 3442.57 MW of installed capacity in wind turbines. In the worst hour in this period, these wind turbines produced 74.297MW of electricity, just under 2.2% of 3442.57 MW. The horizontal dashed line marks the average hourly production of the wind turbines; in the two months plotted this is just over 34%. If, somehow, humanity were able to store the surplus for use when there’s a shortfall, the installed capacity of 3442.57 MW could be converted into a steady supply of 1176.6 MW. In short, not “more than three stages of load-shedding” as too many are quick to state but more like “just over one stage of load shedding”. (In South Africa “a stage of load shedding” is associated with 1000 MW of demand not being met.)
All “renewables”
For too many, there’s a belief that there’s value in variety - that the failure of one “renewable” will be compensated for by over-performance by another “renewable”. In particular, too many believe that the disastrous performance of PV (in the daytime, nothing at night an increasing output until midday then a decrease until sunset) will be compensated for by the output of wind). The graph above makes it clear that wind too follows the sun - there tends to be a maximum followed by a minimum more or less within the space of 24 hours. A plot of “all renewables” destroys that belief.
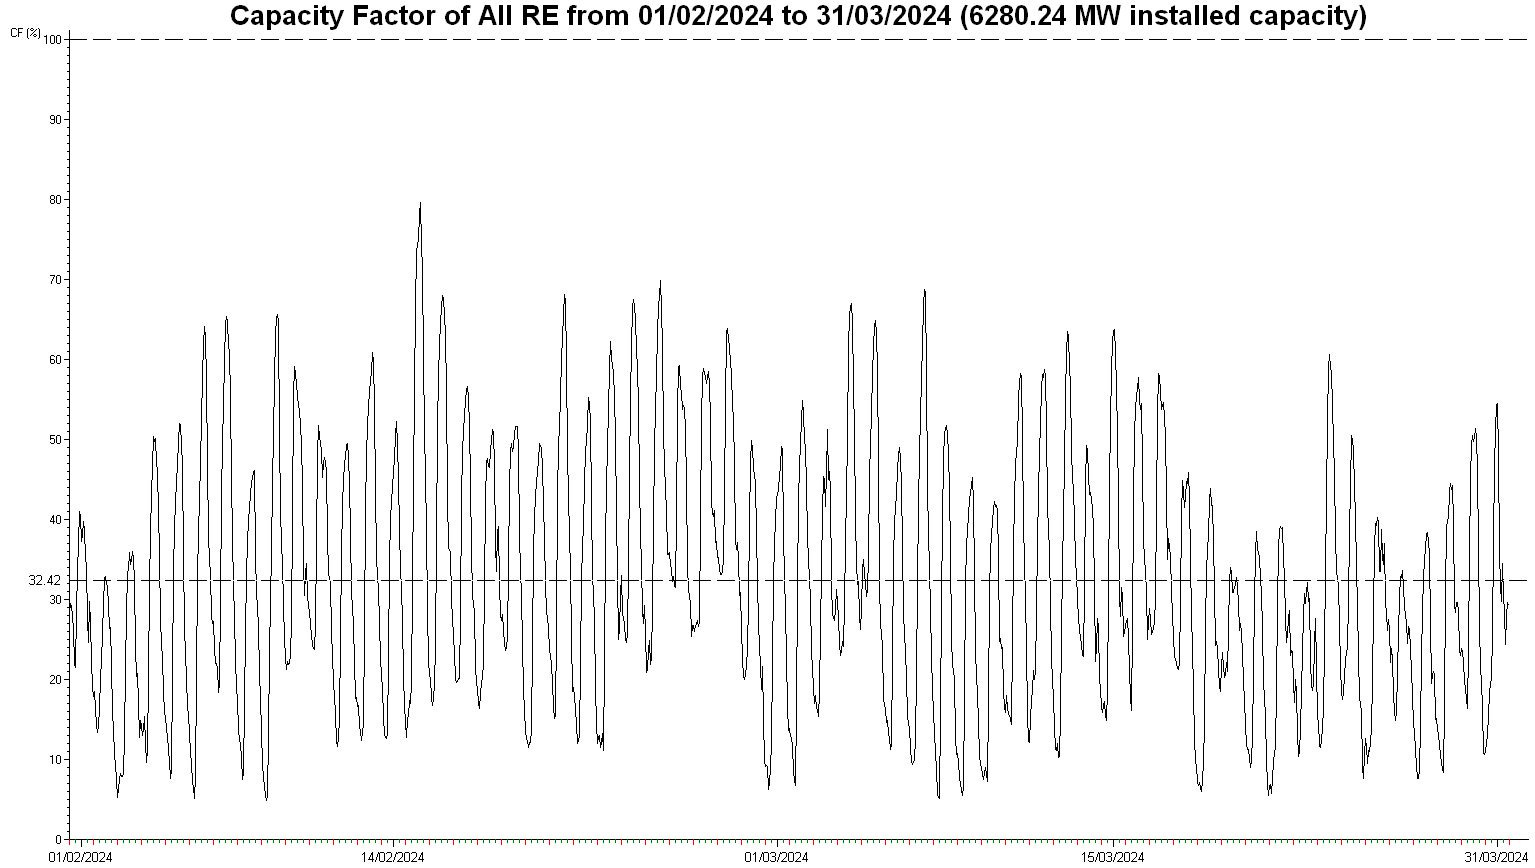
In South Africa “renewables” include wind, PV, Concentrated Solar Power (CSP) and “other renewables”. In the two months plotted, the total of 6280.24 MW was made up (for the entire period) of 3442.57 MW wind, 2287.09 MW PV, 500 MW CSP and 50.58 MW “other renewables”. That’s 0.8% sources other than “wind and solar”, including CSP.
We see that, in South Africa, the pattern of a minimum and a maximum more or less every 24 hours is not alleviated. It is clearly visible. There are other trends and disruptions to the pattern - but it is inarguably present.
Concentrated Solar Power
Concentrated Solar Power (CSP) is considered by too many to be the solution to the problem of the 24 hour cycle visible in the plots above. “It’s OK, guys, we’ll store the power from the sun for use at night”. Let’s examine that claim in South Africa’s context.
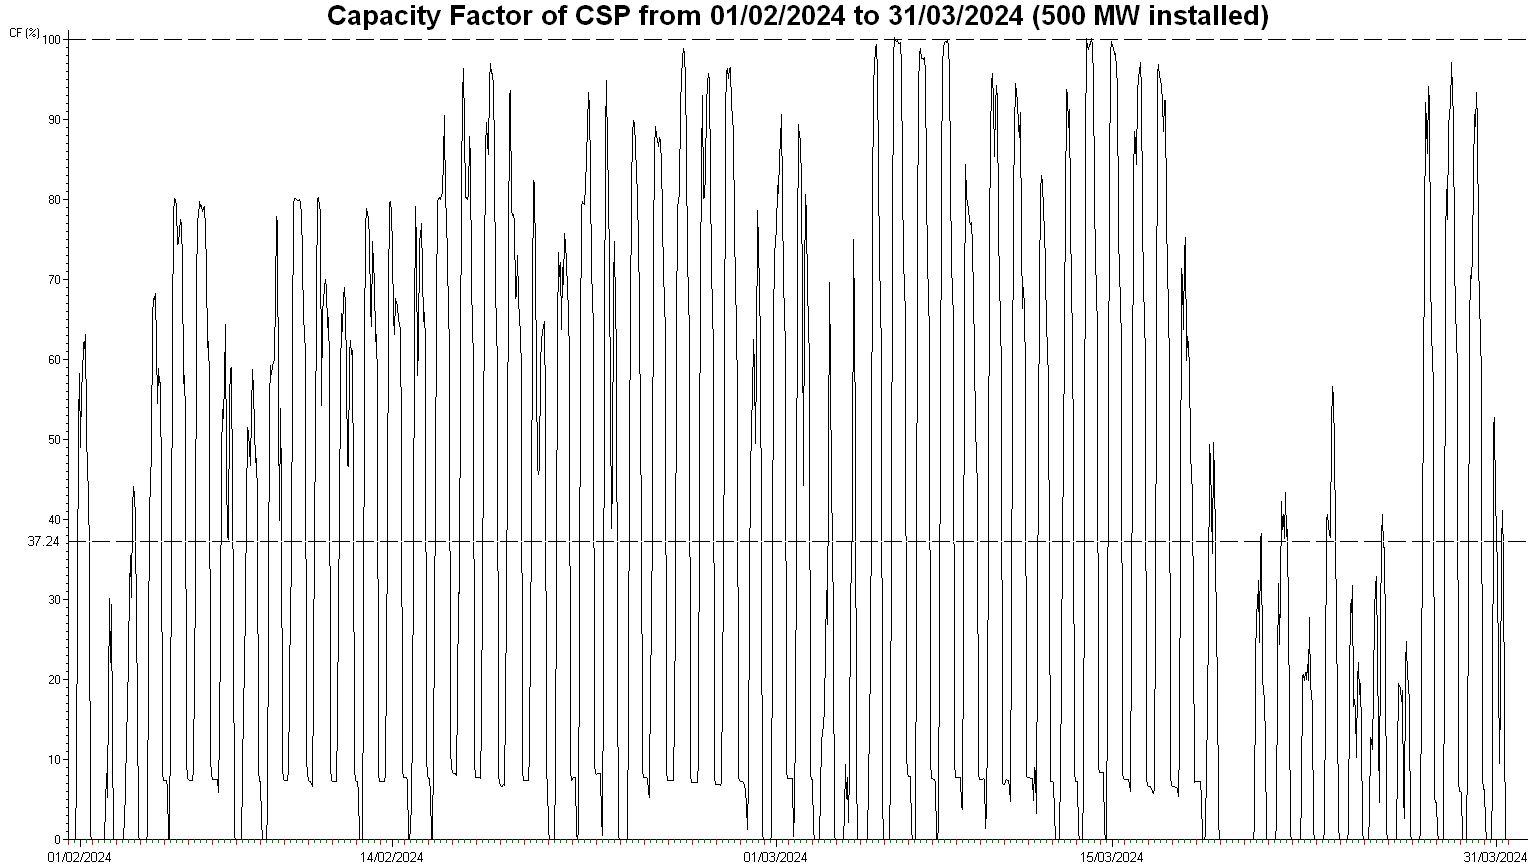
The 24 hour cycle - following the sun - is clearly visible. While CSP has some periods when, in a 24-hour cycle, there is some output from CSP plants, it remains true that this output is considerably less than the output when the sun is high in the sky.
We have to ask: Is it possible, in South Africa, to break the dependence on the sun?
Koeberg
Mention the word “nuclear” to Chris Yelland (or Anton Eberhard, someone Yelland clearly agrees with) and expect an outpouring of bile. Consider this post to X (formerly Twitter):
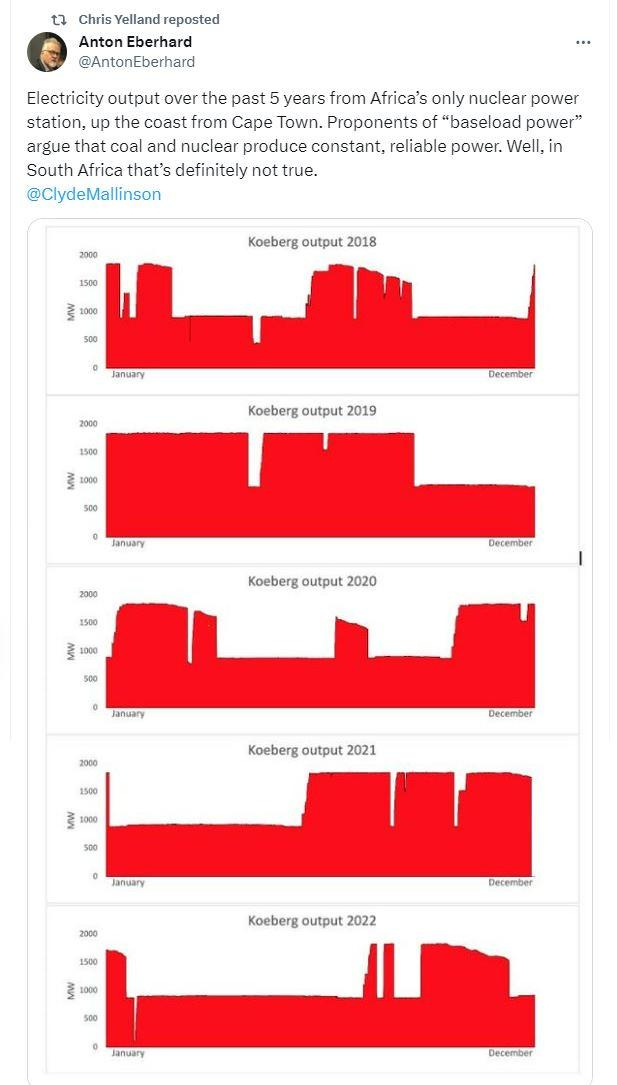
Note how Yelland agreed with Eberhard’s opinion. Eberhard (and by implication, Yelland) imply that the output depicted is neither constant nor reliable. Note however that the graphs in the vertical stack are for an entire year. Note that for long periods in a year, the output is, practically speaking, constant. Let’s compare the unreliable, inconstant output from Koeberg’s unit 1 with the reliable, constant, output from renewables seen in the plots above.
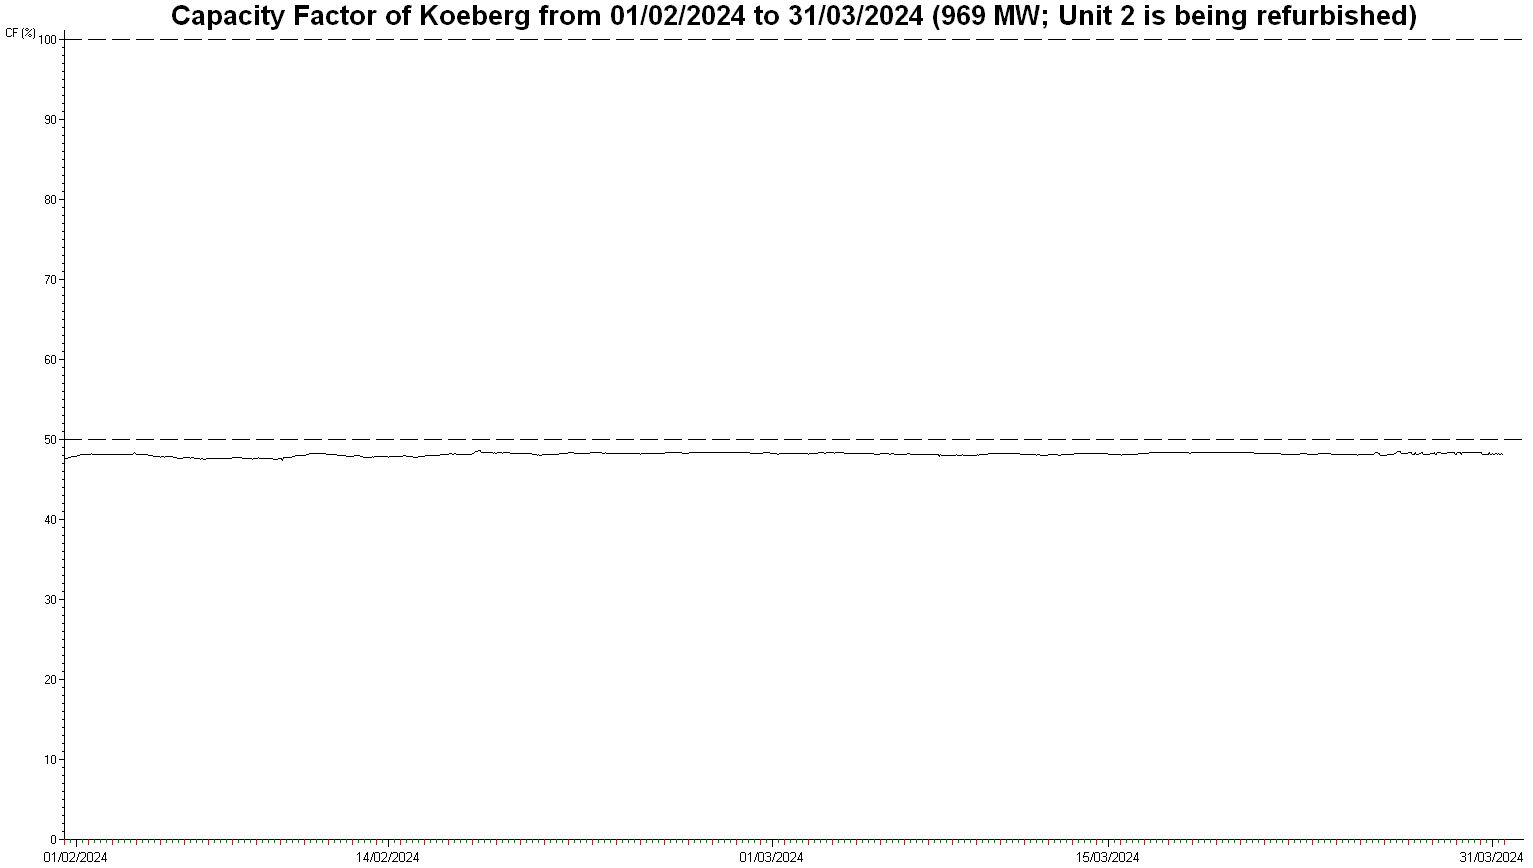
I’ve been unable to find a value for the capacity of Koeberg’s unit one. The best I’ve found is “approximately 1940 MW” for both units after refurbishment. Assuming equality per unit and the same output from the three steam generators driven by each unit (so that, rounded to a MW, a unit’s output is a multiple of 3) I arrive at 969 MW per unit. The plot suggests that this capacity value is an over-estimate. The maximum output in the period was 942.234 MW. The rating this unit had before refurbishment was 924 MW (in 2022).
The sun had no effect whatever on the output from Koeberg’s unit 1.
In my opinion, anybody believing Chris Yelland or Anton Eberhard is someone worth listening to on the topic of electricity generation is someone who’d be willing to fall for the scam of buying the deeds to famous bridges. I, for one, would first check to see what other might have to say on the topic.