

Graphs for Renewable Performance in South Africa in Mar/Apr 2024
Graphs for Renewable Performance in South Africa in Mar/Apr 2024
Graphs prepared using data supplied by Eskom in their Data Portal are collected in this post.

Introduction
Data on the performance of Renewables available from Eskom’s Data Portal is download at the beginning of every month then analysed and graphed for the month just passed and the month before that. This dataset supplies values for every hour of the 24 in a day for every day in a period selected.
For the purposes of comparison, standardization, I calculate the ratio of production by a generator (Wind, PV, Nuclear, whatever) to the maximum potential production of that generator for every hour of the day by that generator. This is the basis of the definition of the “Capacity Factor”, CF, of a generator, but I prefer to calculate the CF for a longer period, my preference being a full year. For this reason, I will refer to to the amount calculated from Eskom’s data as the “Hourly Capacity Factor”. The average of these values in the period is reported as the “CF for the period”.
The Eskom dataset does not include an “Installed Capacity” value for nuclear. My initial guess for this value is 969 MW per unit, a total of 1938 MW for Koeberg after refurbishment of both units. For Wind, PV and so an, the dataset contains pairs of values; a production value in the hour of the day concerned and the “Installed Capacity: of the generator concerned. My analyses are based on the ratio of the numbers in a pair - with 1938 MW the guessed value of the divisor for Koeberg.
I include nuclear under the definition of “renewable” because the point of “fuel” being “renewable” is that it will not run out until the sun burns out (when humanity is extinguished). This characteristic is shared by nuclear fuel. True, it’s consumed but the amount of uranium and thorium available (known reserves) would last humanity for the life of Earth. This is normally described by the term “sustainable” and there is no doubt that renewables (the conventional definition) and nuclear are sustainable.
Graphs
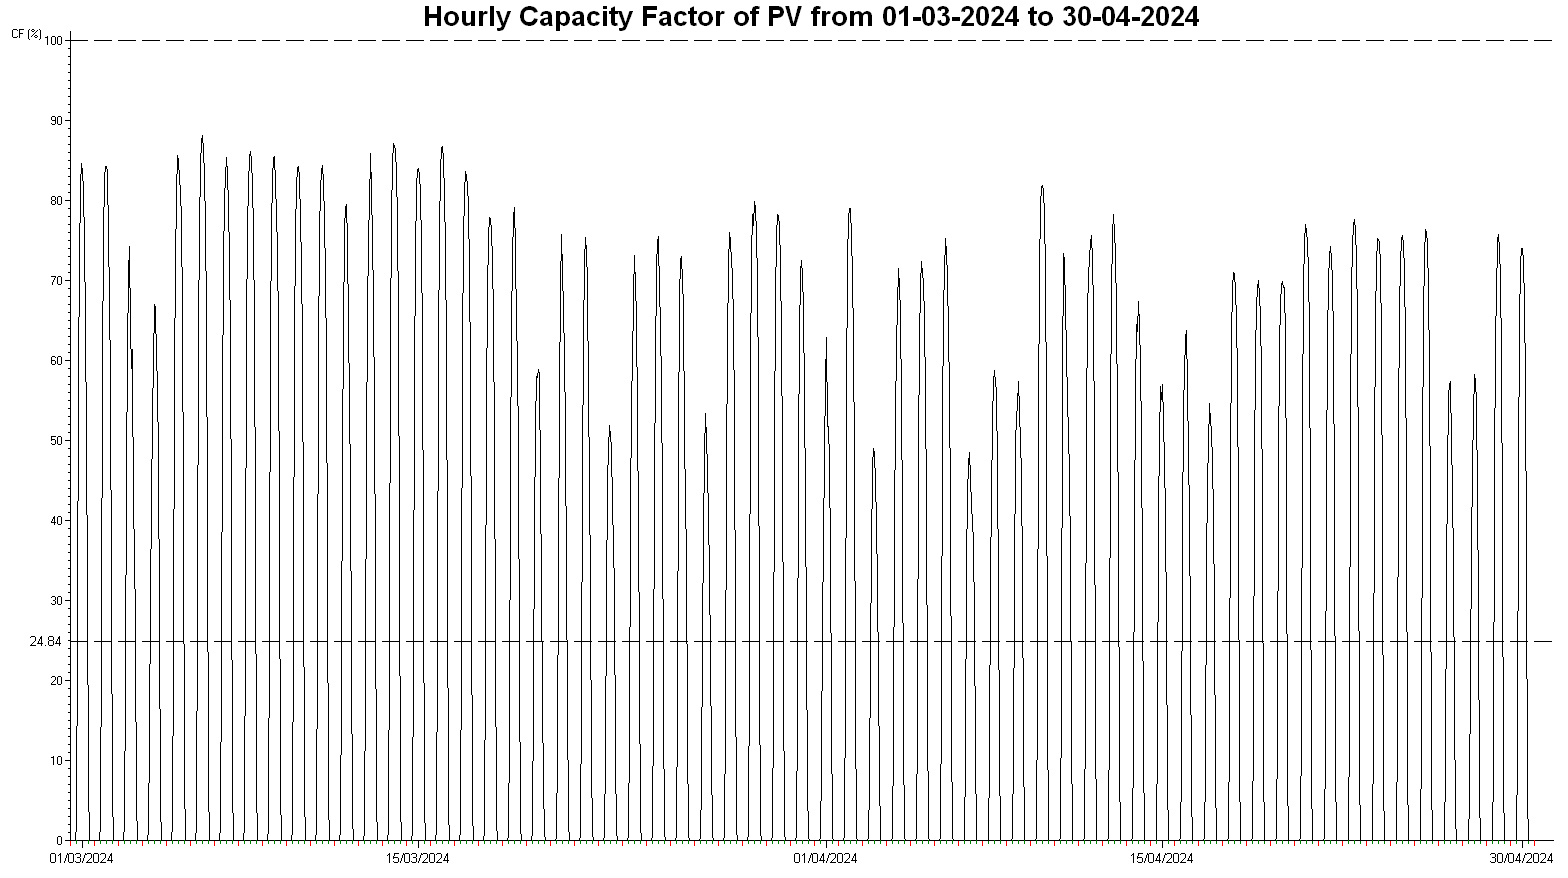
PV
The installed capacity was 2287.09 MW throughout the period. The Capacity Factor in the period was 24.8382%.
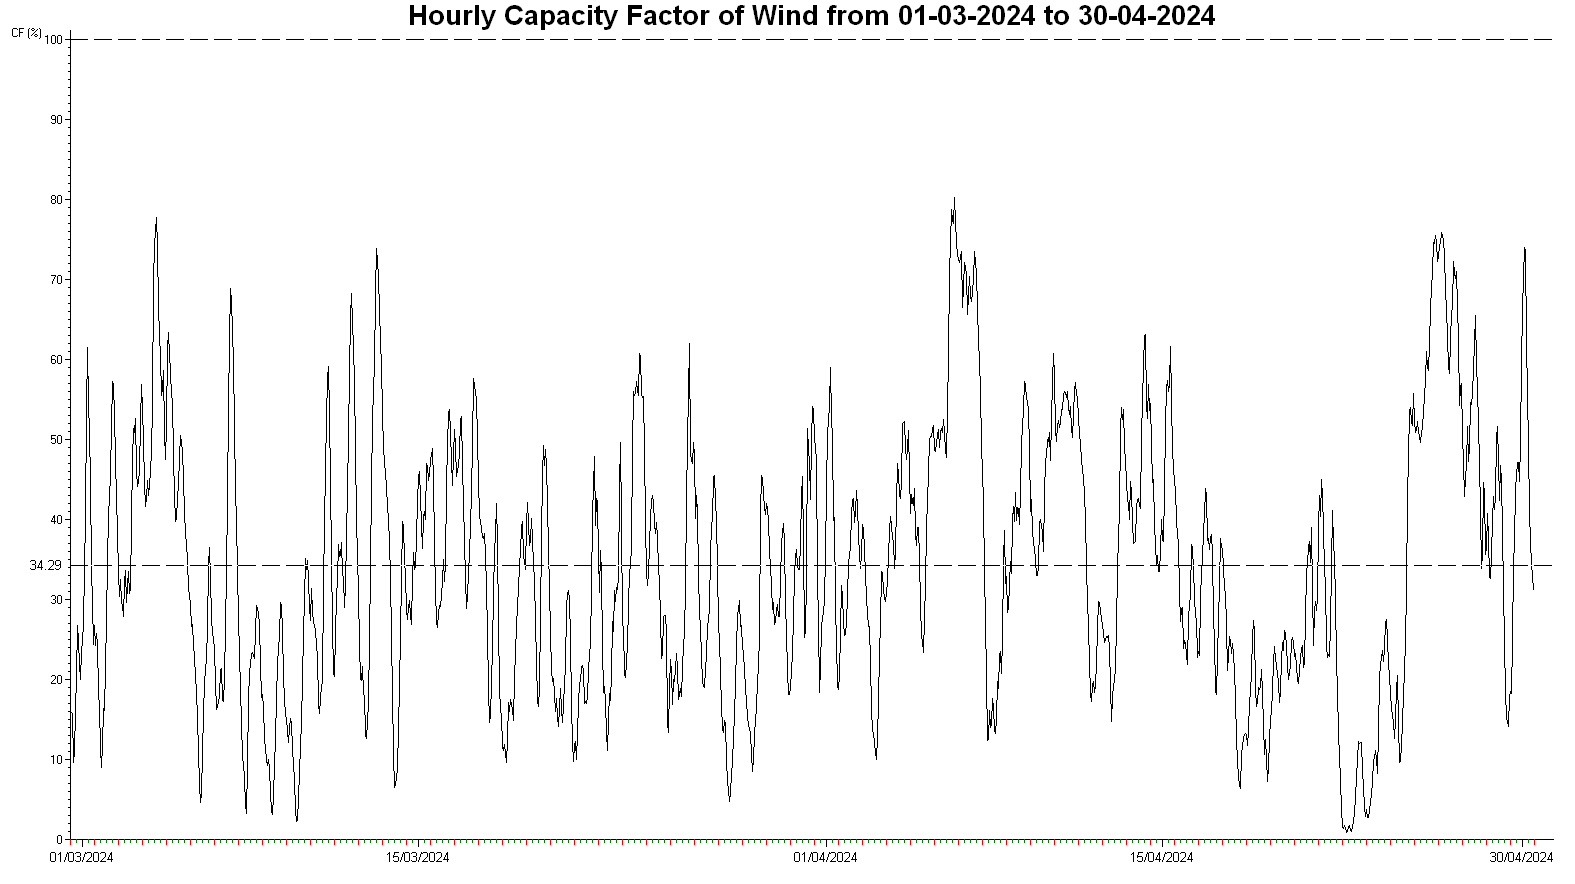
Wind
The installed capacity was 3442.57 MW throughout the period. The Capacity Factor in the period was 34.2852%.
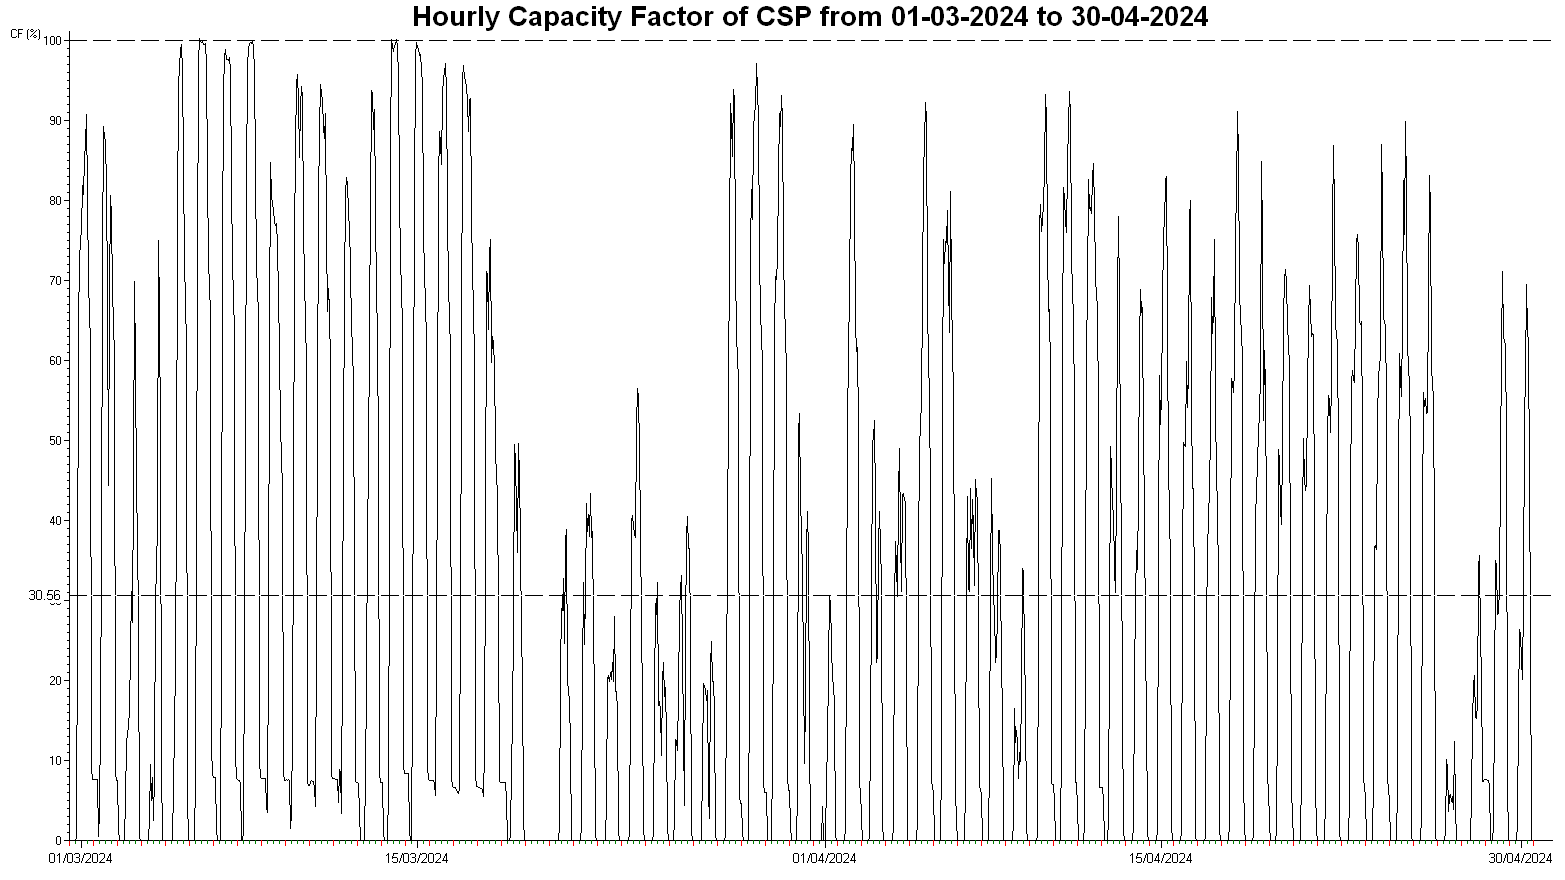
CSP
The installed capacity was 500 MW throughout the period. The Capacity Factor in the period was 30.5633%.
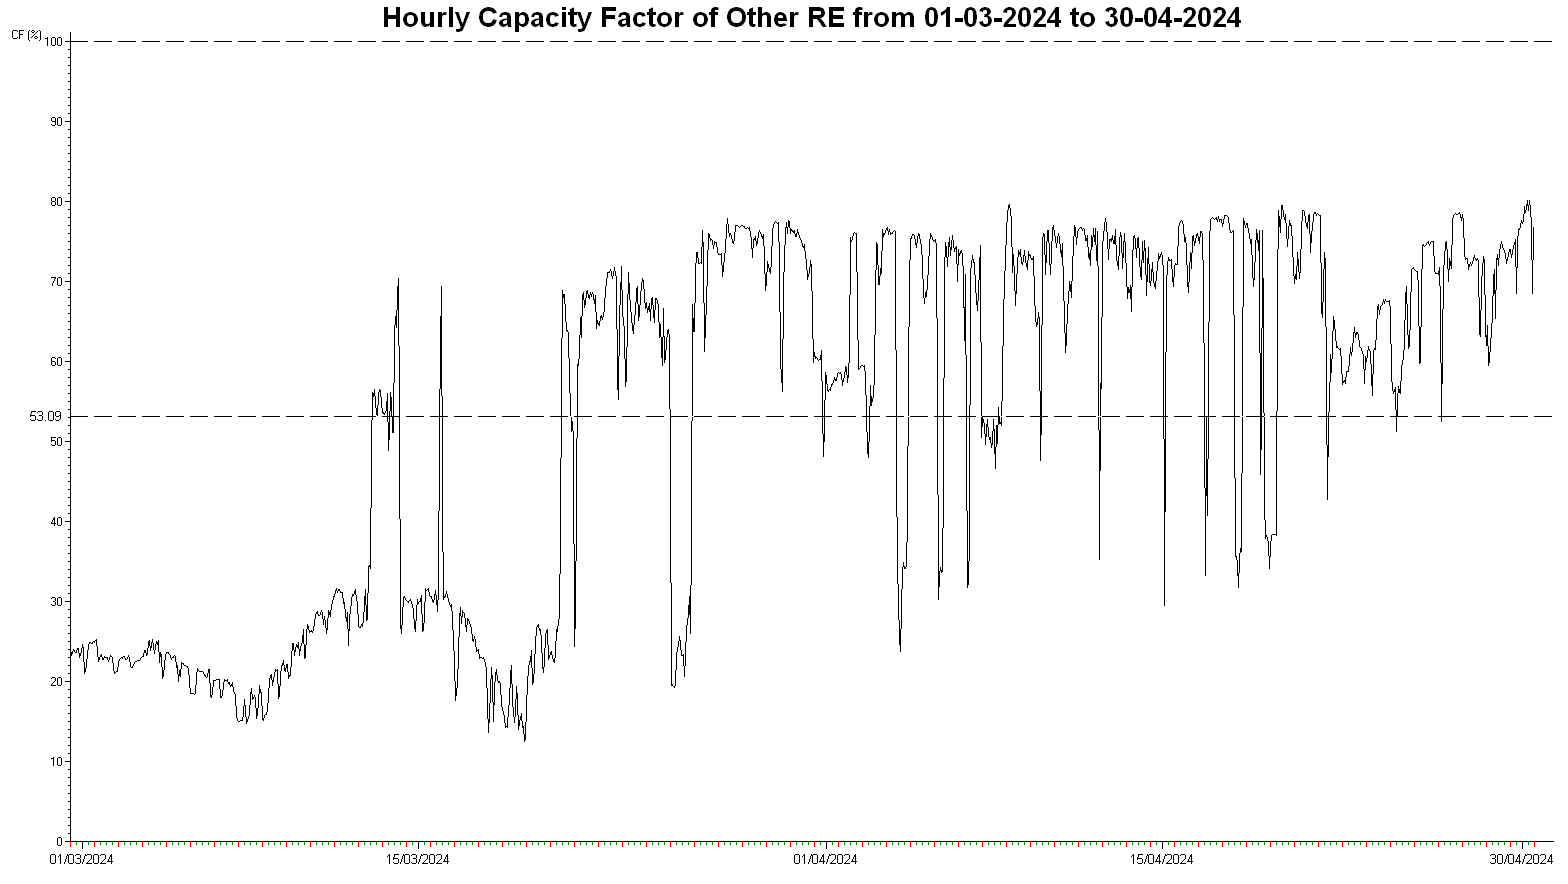
Other RE
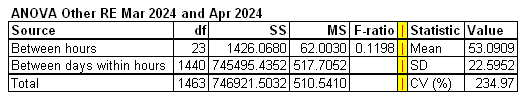
The installed capacity was 50.58 MW throughout the period. The Capacity Factor in the period was 53.0909%.
All RE
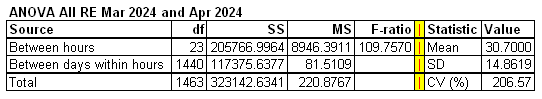
The installed capacity was 6280.24 MW throughout the period. The Capacity Factor in the period was 30.7000%. This plot includes PV, Wind, CSP and Other RE (all the generators reported above).

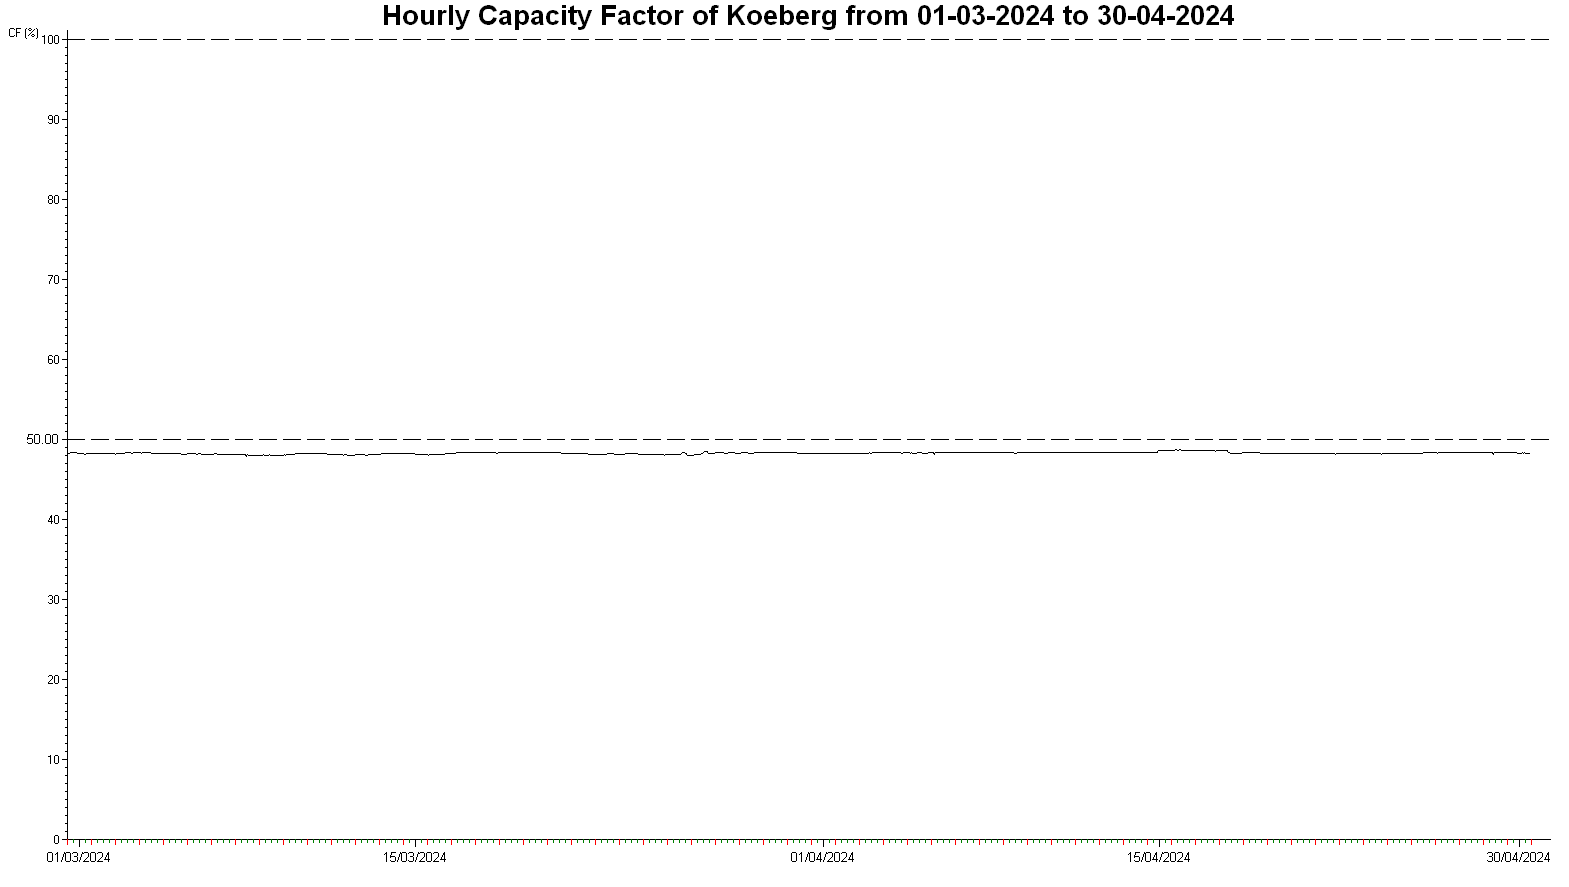
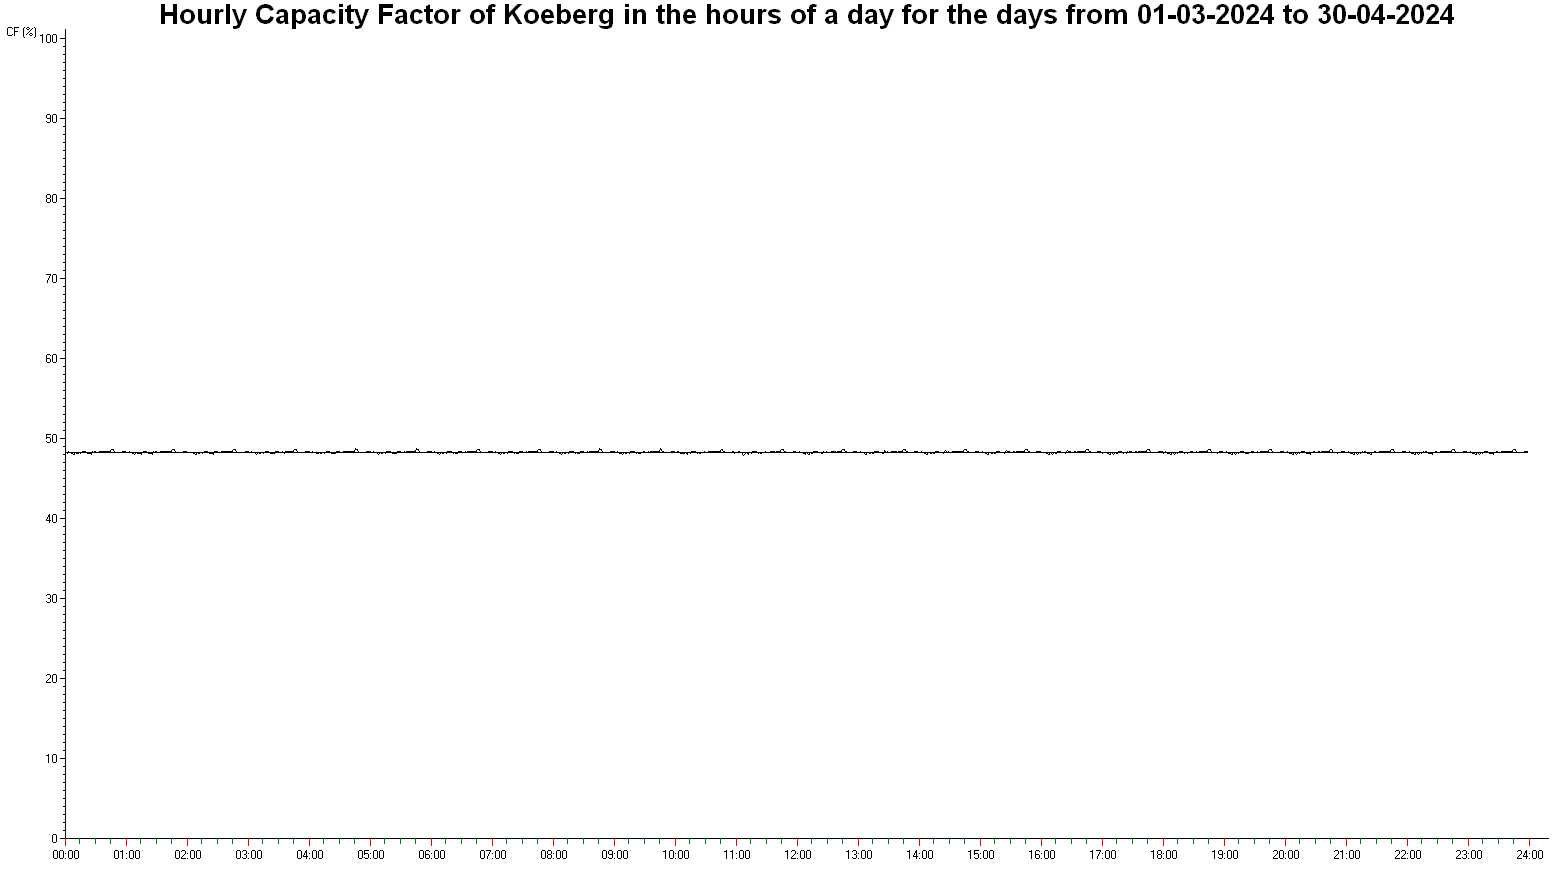
Nuclear (Koeberg)
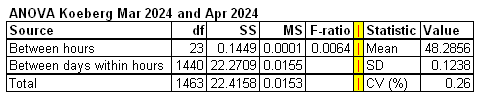
While Unit 2’s refurbishment continues, Koeberg is outputting only half its potential. My guessed value of 969 MW per unit is contradicted by the maximum observed output in the period from 01/01/2024 to 31/04/2024 of 943.764 MW. The Capacity Factor in the period was 48.2856%.
A variations on the graphs above
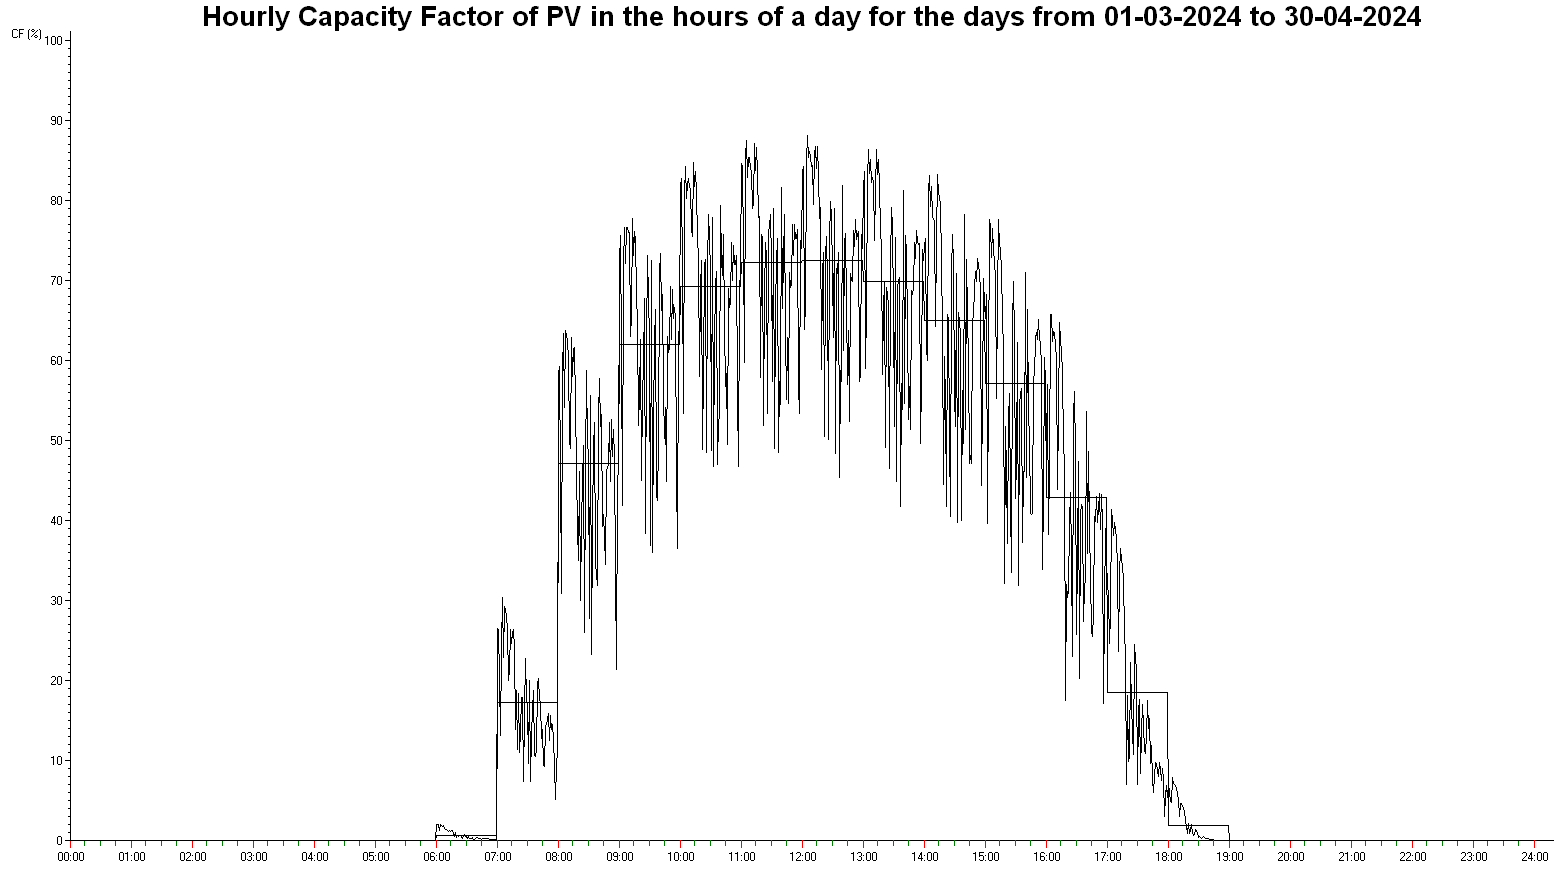
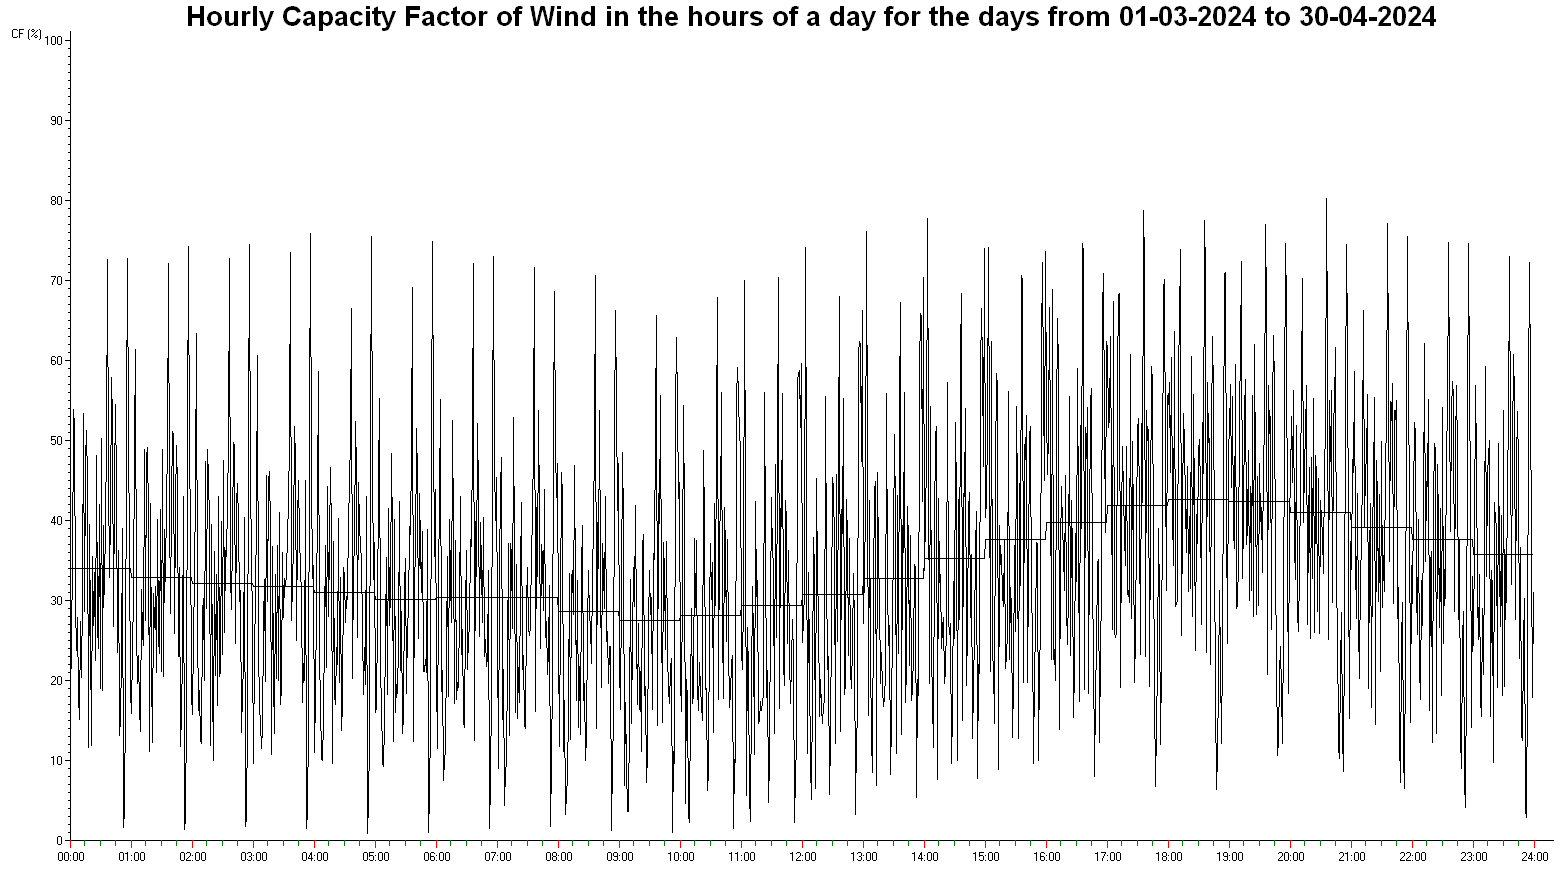
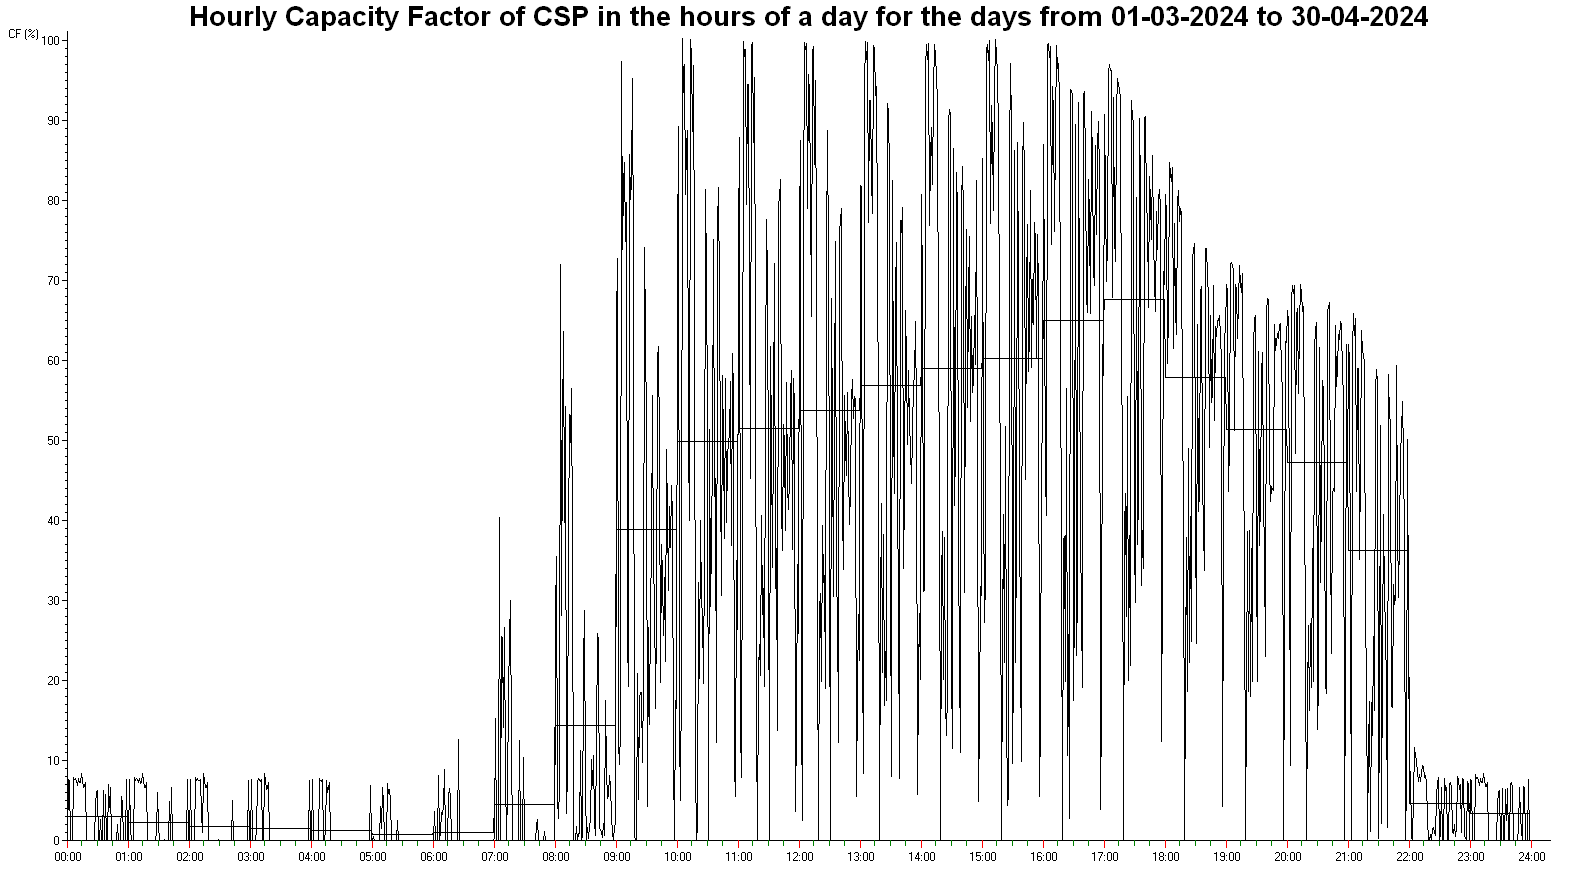
The graphs above plot time along the x-axis; successive days are plotted with the hours of the day, from midnight, through midday to midnight. In the plots below the sequence is rearranged with the hours of the day as the primary sequence and the days in the period as a secondary sequence. This allows an average for the hours of the day to be plotted as an overlay.
PV
Wind
CSP
Other RE

All RE

Nuclear (Koeberg)
Numerical Analysis
Humanity has decided that (if one is to understand the message on display in just about every news outlet I encounter) the use of fossil fuels to generate the majority of the energy consumed (80% in 2024) is a destructive practice and that alternatives must be found. Listen closely and I hear that “renewables” (the definition excluding nuclear power) must have replaced fossil fuels by 2050; or 2018 + 12 = 2030; in a phrase, “very rapidly”. I decided to produce a monthly report to analyse the performance of “renewables” (including nuclear power) in South Africa.
My decision was based on opinions I was encountering which state that “renewables” (excluding nuclear) cannot replace “fossil fuels” (a class which includes “natural gas”, gas recovered from terrestrial resources which consists mainly of methane; burning such materials has carbon dioxide, CO₂, as a waste product). Only “renewables” can, the opinion concludes.
This opinion is countered by the opinion that “renewables” (which, in South Africa, largely excludes hydro-electric power, which for the most part will be wind turbines and varieties of solar power - PV, trough CSP and tower CSP) are too intermittent (they produce only when Mother Nature is smiling) to be reliable. No modern industrialized nation on Earth has ever been powered by “Wind, Water an Sun” (“the 100% WWS opinion”) although some rely mainly on hydropower and/or geothermal power for their electricity supply. (The term “power” includes the fuel for industrial processes, home heating and transport, both on roads and in the air and on the sea, etc - power consumption which might be dependent on electricity but which is currently not electrical at the point of consumption.)
Challenge the 100% WWS opinion, pointing at regions without benefit of hydropower (“water”) or geothermal power (for example, those without the benefits available to Iceland) which experience long periods with insufficient power from wind and solar to power society, and the response is “storage”. This word refers to a variety of solutions, from Pumped Hydro Storage through “batteries” (mainly Li-ion batteries) to Gas-To-Power (GTP) applications. But whatever the word means, it implies a backup system which is to be used only when the primary system is failing. The cost of such the system duplication needs to be properly accounted for. So far, I’ve seen little attempt at honest accounting. The cost of capital invested on equipment standing idle (because the primary system is functioning adequately - or because the primary system is insufficient) appears not to be relevant to those with 100% Wind-Water-Solar (WWS) aspirations.
I decided to produce the graphs offered above because I believe a graph is “data at a glance”. I don’t expect you to wade through the thousands of values in Eskom’s dataset so that you might form an opinion. I’m offering you graphs produced from that dataset which, at a glance, should supply you with the information in the dataset.
Another method of presenting the information a dataset is to offer a limited numbed of summary statistics. The obvious first choice is the arithmetic mean - which is a measure of the typical value in a collection of data values. However an obvious characteristic of almost all data sets is that the values are not uniformly one value - there is variation, a deviation from the average value. A measure of the typical size of this deviation is the standard deviation, SD. For ratio scale variables, the coefficient of variation, CV, combines these two values and is in itself a useful measure. For more details, see my post on the CV.
Two aspects of the graphs above is striking. For all generators there is a clear tendency during the course of a day - and for all generators there is some degree of variation about the typical value for a day. these two sources of variation may be evaluated and contrasted in a standard tool known as a One Way Analysis of Variance (or, briefly, a One Way ANOVA). For more details, see this post. I’ve reported this analysis up to the level of the F-ratio, the ratio of the Mean Square Between Hours to the Mean Square Within Hours but the measure cannot be easily used in the manner it is normally used. In this analysis it merely contrasts the two sources of variation. It is to be used when comparing generators.
The summaries follow.
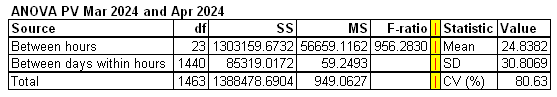
PV
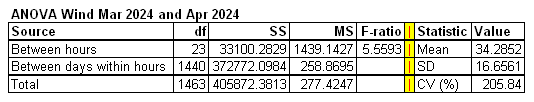
Wind
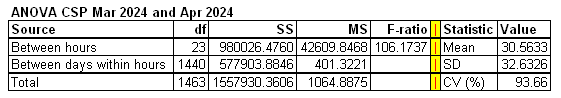
CSP
Other RE
All RE
Nuclear (Koeberg)
Summary
Presenting summary statistics in a single table facilitates comparison.
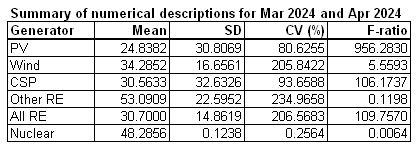
Nuclear, Koeberg, has the lowest CV and F-ratio; it is easily the most constant, most reliable, most invariant producer of power in the list. Wind and Solar (PV and CSP) are often described as complimentary and here we see that although the CF for the period is similar for PV, CSP and Wind, the SD of Wind (16.6) is roughly half that of PV and CSP (30.8 and 32.6, respectively) so the CV of Wind is roughly double that of PV and CSP. The F-ratio, the ratio of the variability between the hours the day to the variability between the days for an hour of the day is massive for PV (956.3), CSP is an improvement (106.2) on PV but it does not make Solar comparable to Wind (5.6).